1
2
3
4
5
6
7
8
9
10
11
12
13
14
15
16
17
18
19
20
21
22
23
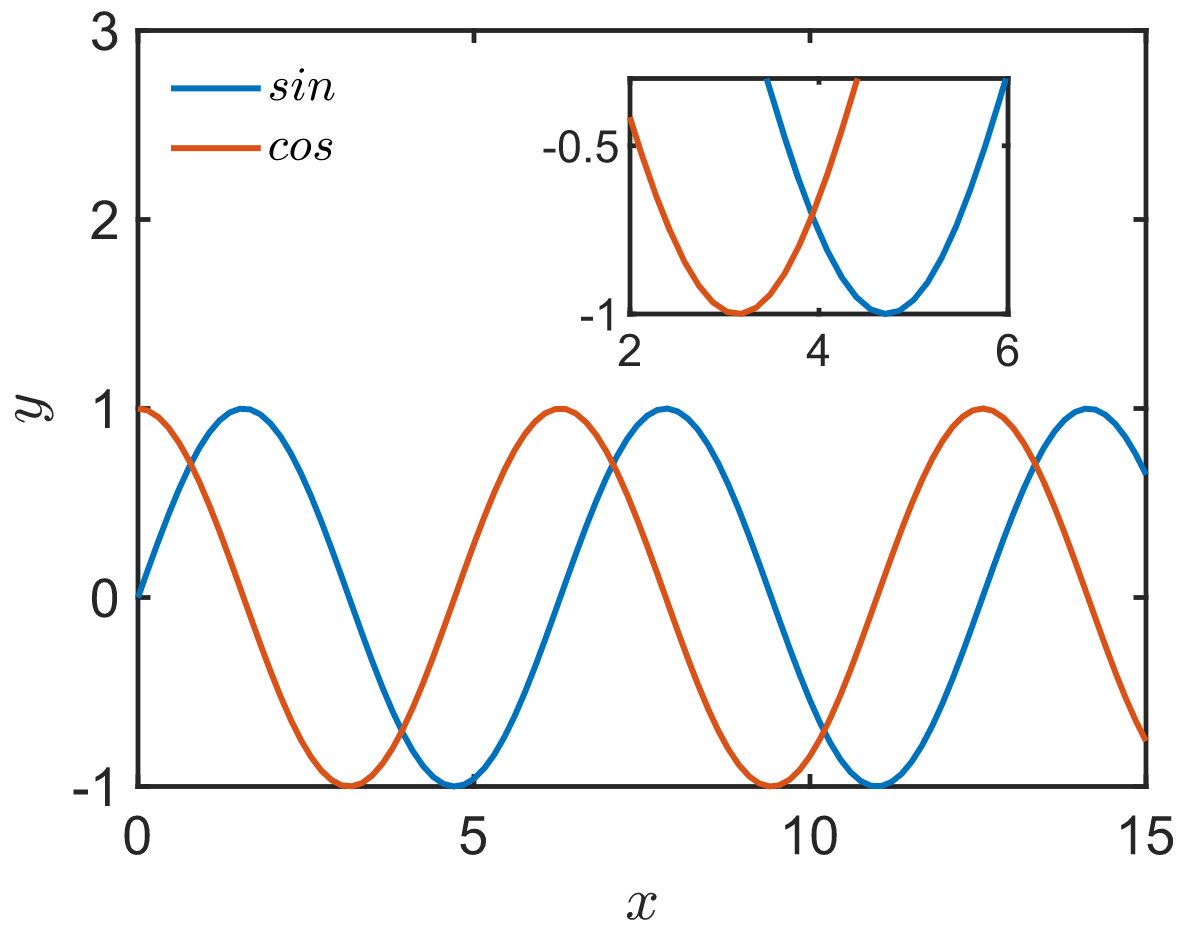
| func = {@(x) sin(x), @(x) cos(x)};
x = linspace(0, 15);
figure;
ax1 = axes('Position', [0.11, 0.15, 0.8, 0.8]);
ax2 = axes('Position', [0.5, 0.65, 0.3, 0.25]);
for i=1:length(func)
plot(ax1, x, func{i}(x));
hold(ax1, 'on');
plot(ax2, x, func{i}(x));
hold(ax2, 'on');
end
xlim(ax1, [0, 15])
ylim(ax1, [-1, 3])
xlabel(ax1, '$x$', 'Interpreter', 'latex');
ylabel(ax1, '$y$', 'Interpreter', 'latex');
legend(ax1, {'$sin$', '$cos$'}, 'Location', 'northwest', 'Interpreter', 'latex')
xlim(ax2, [2, 6])
ylim(ax2, [-1, -0.3])
|